Candela Technologies Logo
Network Testing and Emulation Solutions

Using LANforge python script to test QoS on WiFi Networks

Goal: Create data connections with different QoS settings and report on throughput and latency

This script automates creating data connections with BK, BE, VI, VO and/or other QoS settings. It then runs the tests for a specified amount of time and reports on latency and throughput. The report is an xlsx spreadsheet that can be opened in your favorite spread-sheet tool. This script requires LANforge 5.4.2 or higher.
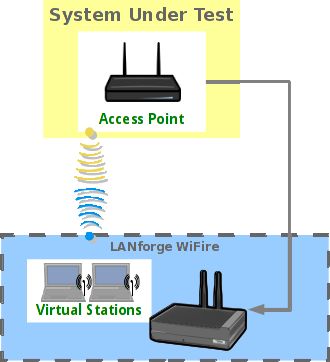
 
  1. Create and configure stations to talk to your DUT. You may create these through Chamber View scenarios or other methods. Please refer to introductory cookbooks for more information on this if you have questions.
  2. Run lf_tos_test.py script.
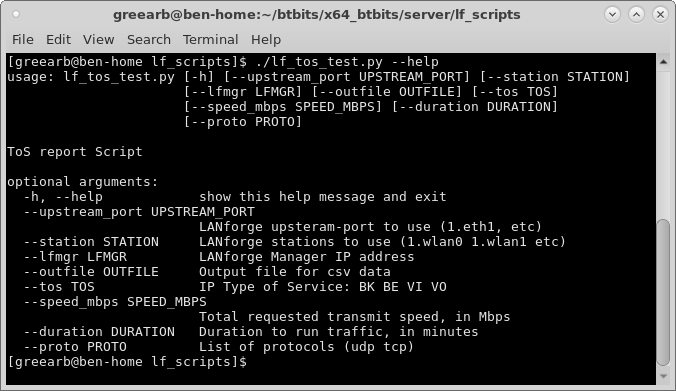
    1. Change directory to the /home/lanforge/scripts directory (or other location if you have installed scripts elsewhere), and run the lf_tos_tst.py script with the --help argument to understand your options.. screenshot
    2. Run the script with arguments for your test case. The basic idea is to provide a list of stations you wish to use for traffic generation, the upstream port, the type of service settings to use, requested bandwidth, etc.
      Examples
      Run BE, BK, VI VO traffic between eth1 and sta0000, 500Mbps total traffic requested, with 15 second duration:
      ./lf_tos_test.py --upstream 1.eth1 --lfmgr 192.168.100.156 --station "1.sta00000" \
       --tos "BK BE VI VO" --speed_mbps 500 --duration 0.25 --proto "udp"
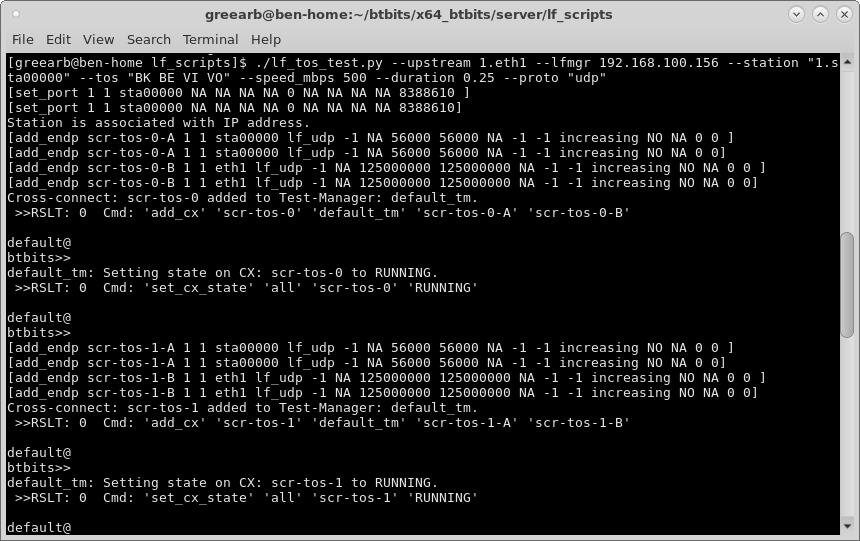
      screenshot
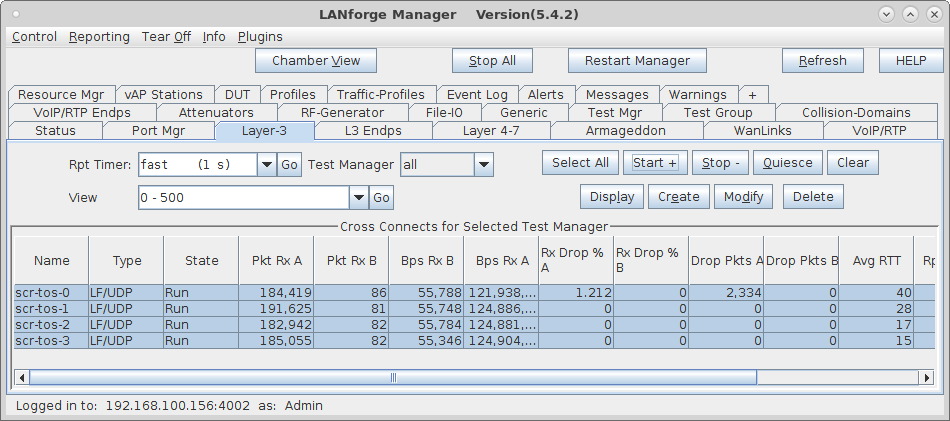
    3. The auto-created data connections can be found in the Layer-3 tab in the LANforge GUI. screenshot
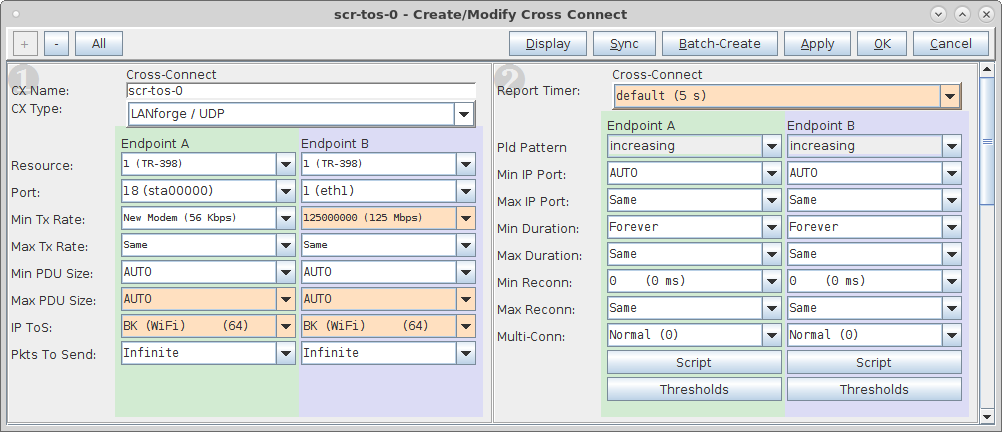
    4. Here are the details of one of the connections. screenshot
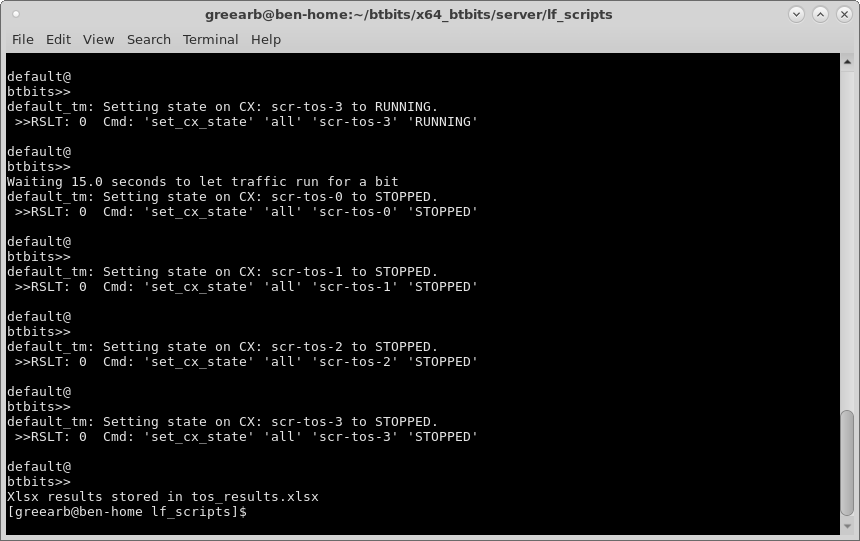
    5. The script will run for the requested duration and then stop the traffic and generate the xlsx report. screenshot
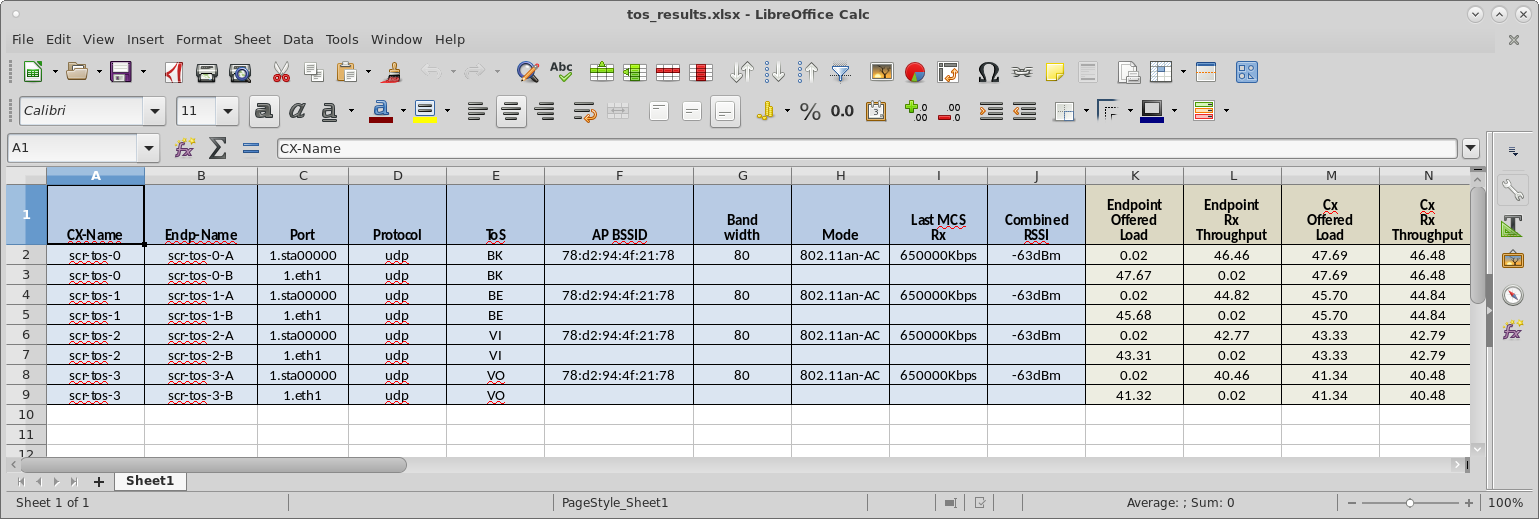
    6. You can open the xlsx report in your favorite spread sheet tool. Here is the first part of the document. screenshot
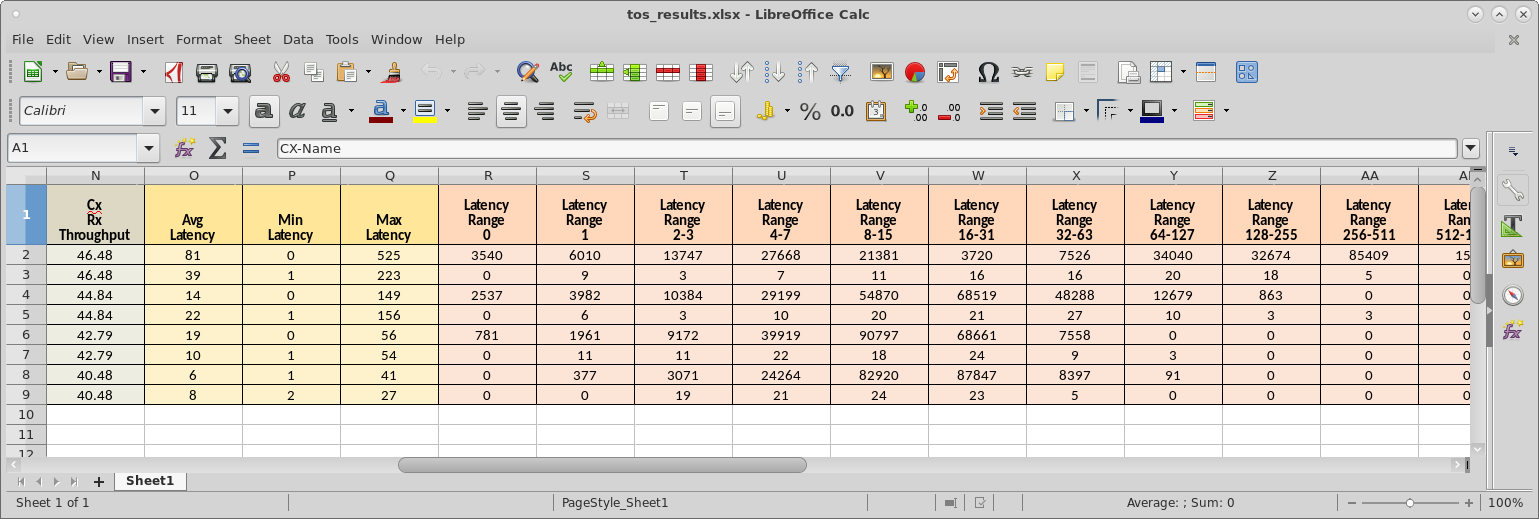
    7. The more interesting part of the report is the throughput and latency results. The latency-range columns show the amount of packets received in certain latency ranges. This gives you an idea of jitter and other latency related information. The average latency is a good way to get a quick idea of the latency. screenshot
    8. For more details, see the spread-sheet result from this test.
      There is also a more advanced script that does similar work, see: ./lf_tos_plus_test.py --help, example output.

Candela  Technologies, 2417 Main Street, Suite 201, Ferndale, WA 98248, USA
www.candelatech.com | sales@candelatech.com | +1.360.380.1618
Facebook | LinkedIn | Blog