Candela Technologies Logo
Network Testing and Emulation Solutions

Using LANforge python script to generate a mix of traffic and capture it.

Goal: Create WiFi stations with specified a/b/g/n/AC/AX modes and spatial streams, data connections with different QoS, packet size and offered load settings and report on throughput and latency. Captures will be made of the offered traffic and also the RF packet capture for processing by external tools.

This script automates creating data connections with BK, BE, VI, VO and/or other QoS settings, as well as packet sizes, protocol type, and offered load. It then starts packet captures on the Ethernet port and RF monitor interfaces. The traffic and packet captures run for a specified amount of time and XLSX and CSV reports are generated to report latency and throughput. The packet captures are placed into a directory for post-processing by user-supplied tools. This script requires LANforge 5.4.2 or higher.
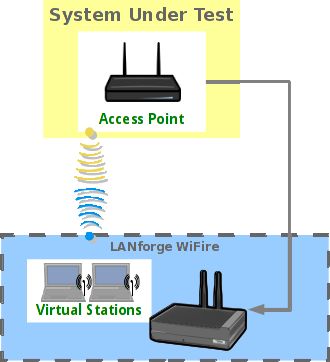
 
  1. This test does not require much initial configuration. In this example, I have removed all existing WiFi station and data connection configuration before running the script.
  2. Run lf_tos_plus_test.py script.
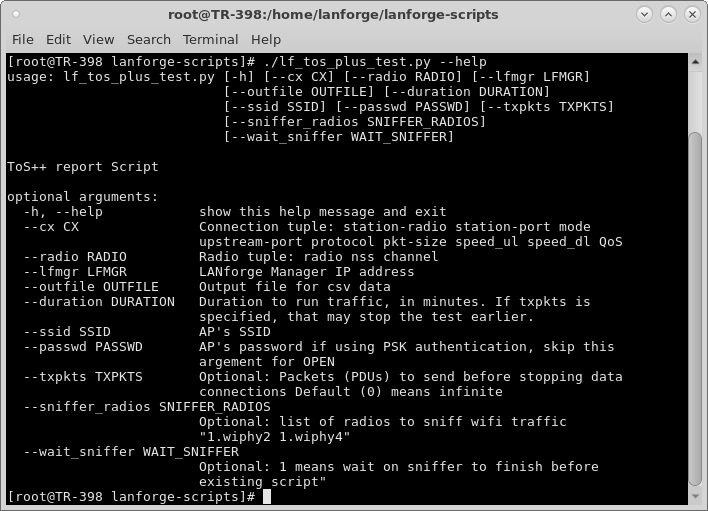
    1. Change directory to the /home/lanforge/scripts directory (or other location if you have installed scripts elsewhere), and run the lf_tos_plus_tst.py script with the --help argument to understand your options.. screenshot
    2. Run the script with arguments for your test case. The basic idea is to provide a list of connection definitions you wish to use for traffic, along with some additional test-wide configuration.
      --cx
      Use multiple '--cx' arguments to create as many data connections as you wish.
      Each cx argument takes a list of configuration input:
      station-radio station-port mode upstream-port protocol pkt-size speed_ul speed_dl QoS
      For instance:
      --cx "1.wiphy0 1.wlan0 an 1.eth1 udp 1024 10000 500000000 BK"
      The example above creates a wlan0 interface in /AN mode on radio wiphy0. The eth1 port is the upstream side of the data connection. The protocol type is UDP, with 1024 byte payloads. Upload speed is 10kbps, download speed is 500Mbps, and ToS/QoS is Background.
      --ssid
      The --ssid specifies the SSID for the AP under test.
      --passwd
      The --passwd specifies the DUT password (PSK). If this option is not specified, then OPEN authentication will be used.
      --radio
      The '--radio' option allows one to configure the number of spatial streams and channel for a radio used in this test. In this example, we are forcing the radio to use 2 spatial streams and using channel 0 (which means use ANY available channel).
      Example: --radio "1.wiphy0 2 0"
      --dur
      The --dur option determines the duration in minutes for the traffic connections and packet capture.
      --txpkts
      The --txpkts option configures data connections to generate a certain amount of PDUs and then quiesce the test. The test will complete when all connections are finished or the duration timer has expired, whichever is less.
      --sniffer_radios
      The --sniffer_radios allows you to select a list of radios to be used as packet capture devices. The first radio selected will capture on the first WiFi interface configured in the --cx section, the second for the second --cx, etc. The script automatically takes care of configuring the sniffer for the proper channel, and in the case of OFDMA radios, it will be configured for the specific AID so that it can capture OFDMA traffic.
      --wait_sniffer
      The --wait_sniffer option causes the script to pause until the sniffer programs have completed before existing the script. This makes automation easier since you then know the captures are complete when the script exits.

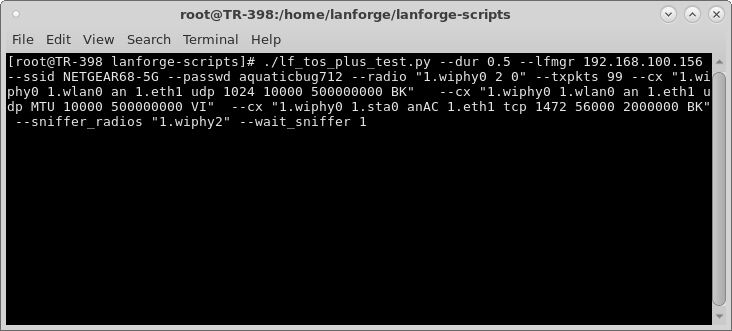
      The command used in this example is:
      ./lf_tos_plus_test.py --dur 0.5 --lfmgr 192.168.100.156 --ssid NETGEAR68-5G --passwd aquaticbug712 --radio "1.wiphy0 2 0" --txpkts 99
      --cx "1.wiphy0 1.wlan0 an 1.eth1 udp 1024 10000 500000000 BK"
      --cx "1.wiphy0 1.wlan0 an 1.eth1 udp MTU 10000 500000000 VI"
      --cx "1.wiphy0 1.sta0 anAC 1.eth1 tcp 1472 56000 2000000 BK"
      --sniffer_radios "1.wiphy2" --wait_sniffer 1
      screenshot
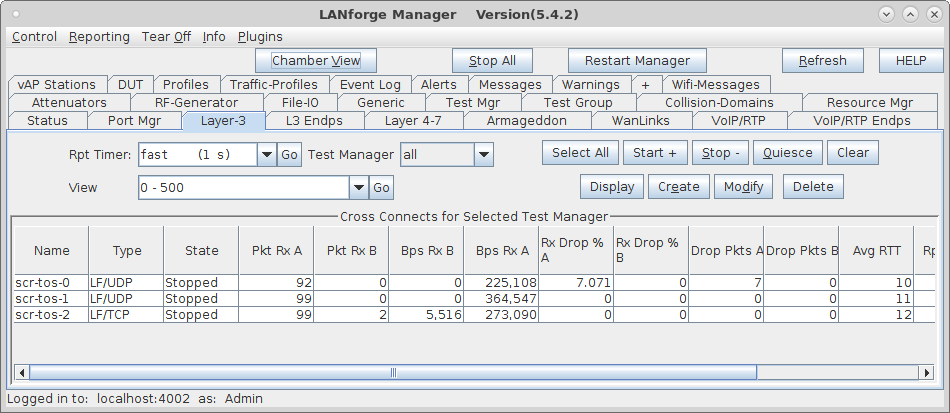
    3. The auto-created data connections can be found in the Layer-3 tab in the LANforge GUI. screenshot
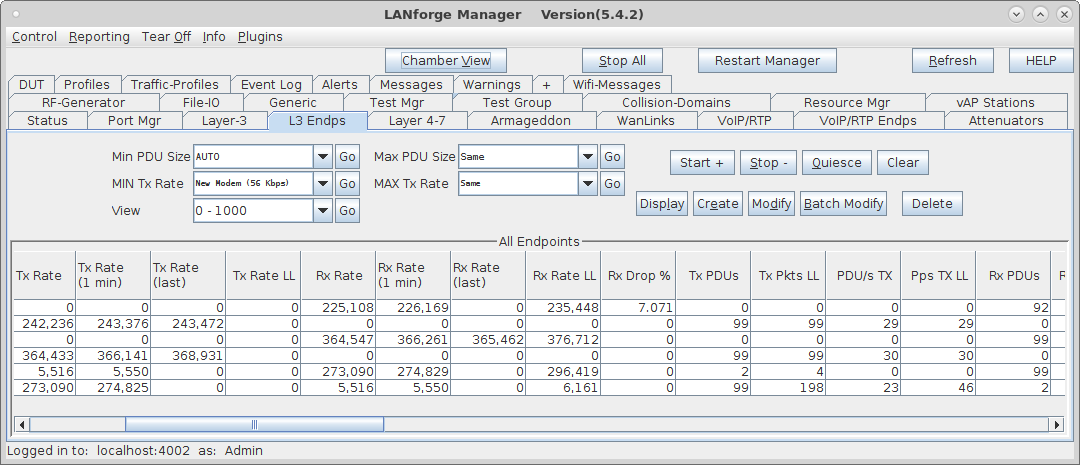
    4. Here are the details of the endpoints. Notice each sent 99 pdus as requested with the --txpkts option. screenshot
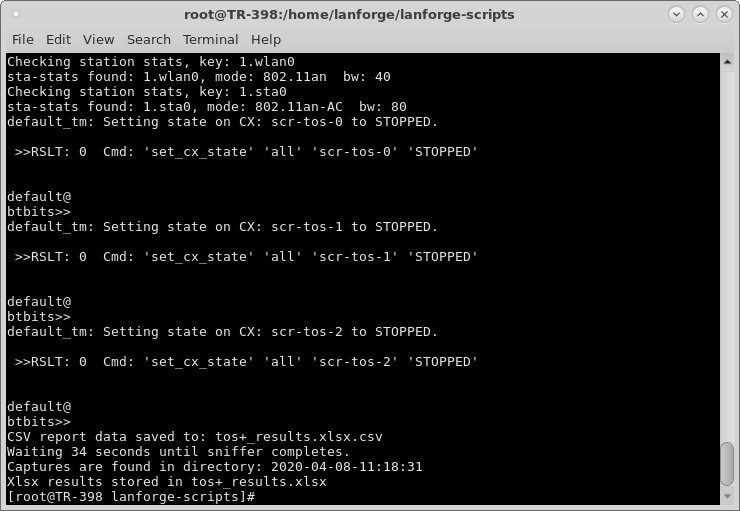
    5. The script will run for the requested duration and then stop the traffic and generate the xlsx report. screenshot
    6. You can open the xlsx report in your favorite spread sheet tool. Here is the first part of the document. screenshot
    7. The more interesting part of the report may be the throughput and latency results. The latency-range columns show the amount of packets received in certain latency ranges. This gives you an idea of jitter and other latency related information. The average latency is a good way to get a quick idea of the latency. In this case, we are only generateing 99 packets, so the report is of limited use. When sending more data, this data becomes more useful. screenshot
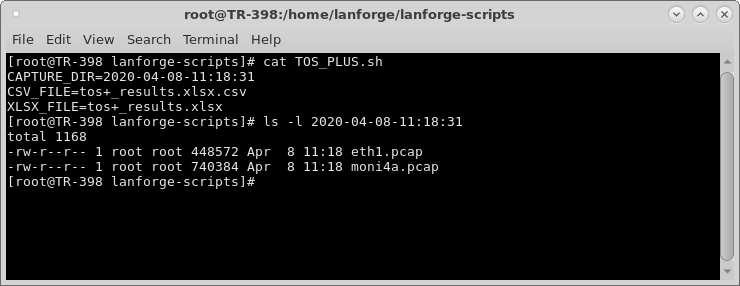
    8. This script is designed to work well with automation. It creates a file called TOS_PLUS.sh that holds some shell variables defining the name of the XLSX and CSV files, as well as the capture directory. The capture files may be opened with wireshark or your other favorite packet analyzer, as well as post-processed by other automated tools. For instance, you can find a LANforge packet in the eth1 capture and the same packet in the RF monitor pcap file and compare the latency. If you are capturing on multiple radios at once, you may wish to merge the captures with the mergecap tool or similar tool. screenshot

Candela  Technologies, 2417 Main Street, Suite 201, Ferndale, WA 98248, USA
www.candelatech.com | sales@candelatech.com | +1.360.380.1618
Facebook | LinkedIn | Blog