Candela Technologies Logo
Network Testing and Emulation Solutions

Watch ports and stations with the Monitor Port plugin.

Goal: Display a bandwidth meter for ports and stations.

You can display a series of meters for one or more ports with a nice demo window for traffic speed. For this demonstration, we have configured a station, an upstream port, and a Layer-3 connection to generate traffic.
 
  1. Single port display

  2. The simplest example for port monitoring is showing only one station.
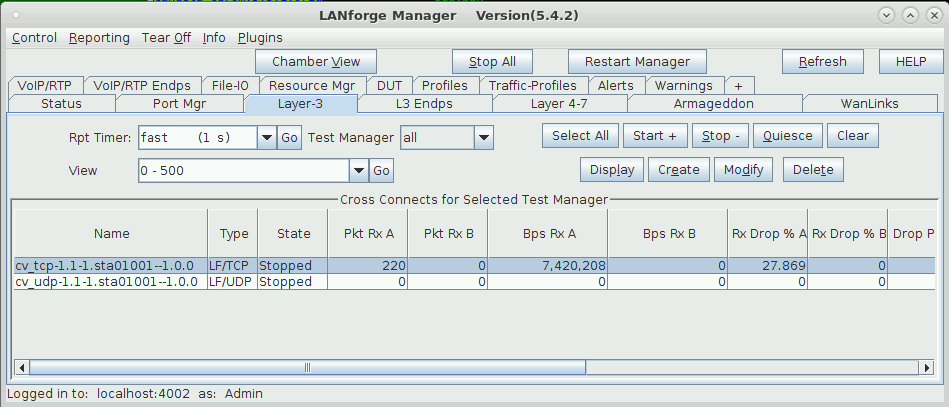
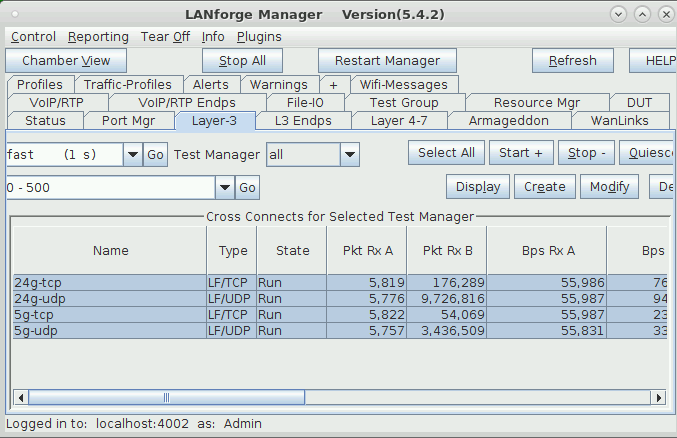
  3. We will start our Layer-3 connection. screenshot

    For more information see Generating Traffic to a Switched Network
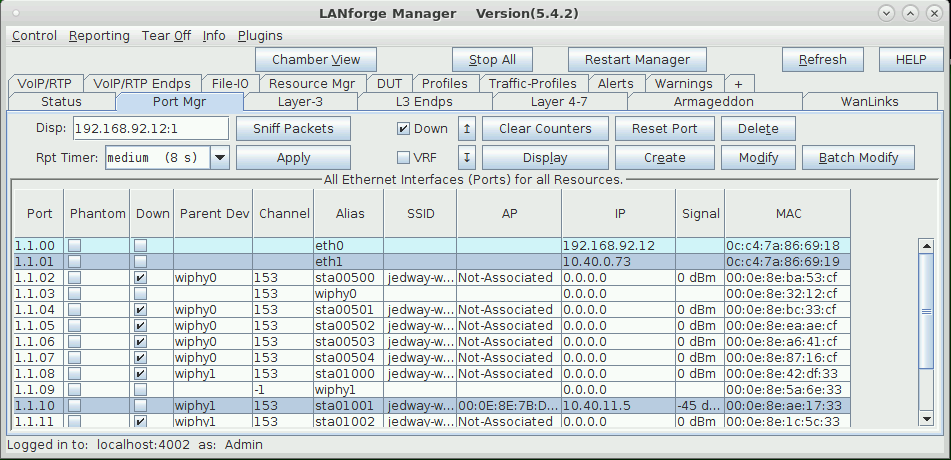
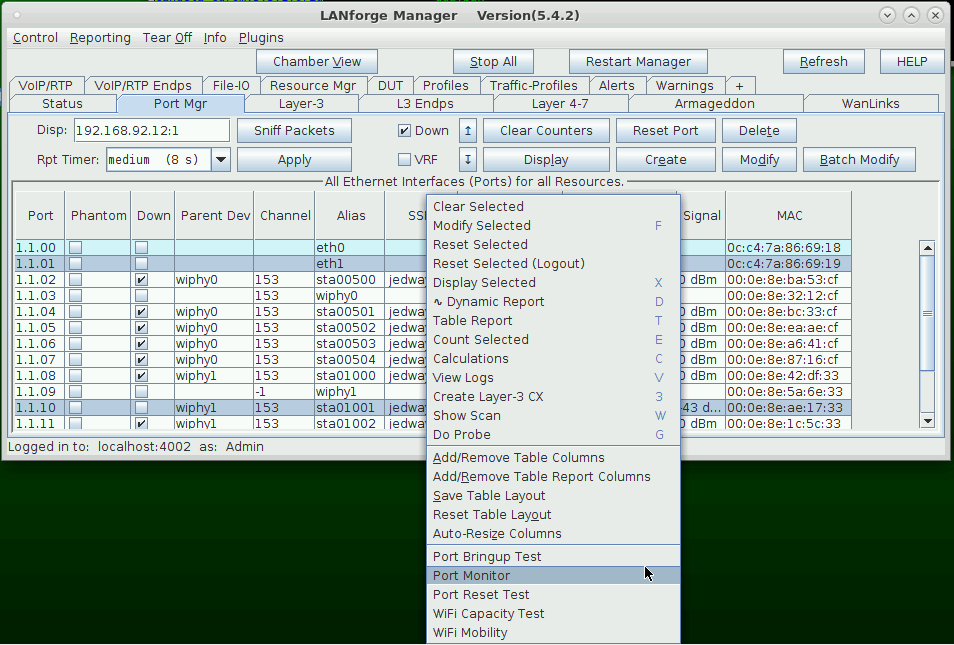
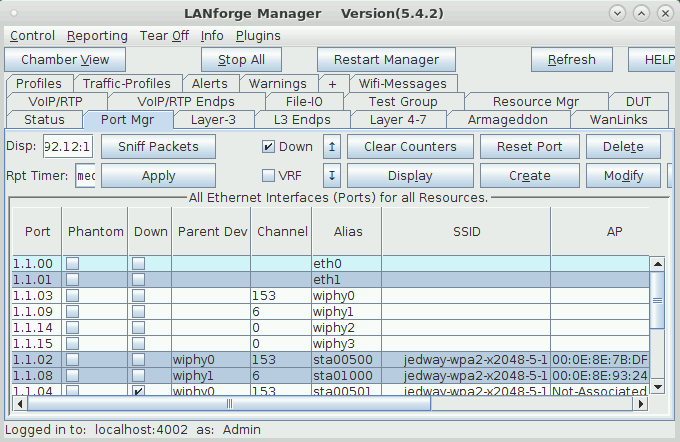
  4. After starting the Layer-3 connection, click on the Port Mgr tab; you will see your connection ports highlighted. screenshot
  5. Right click on one of the selected ports, and select Port Monitor. screenshot
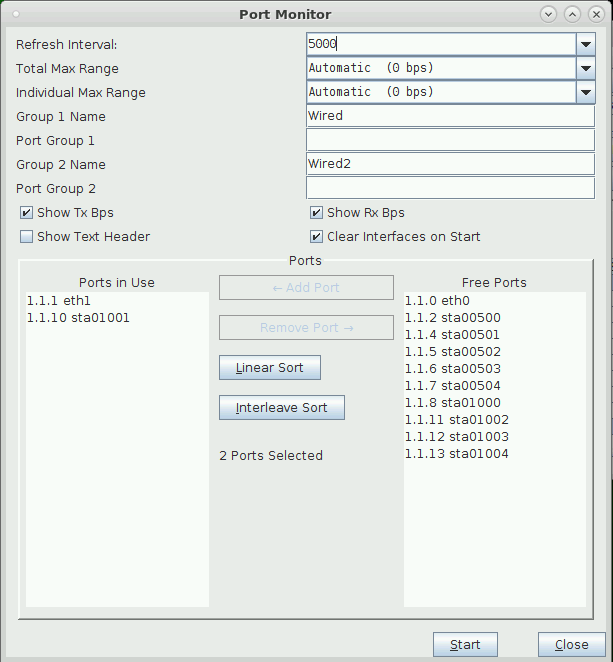
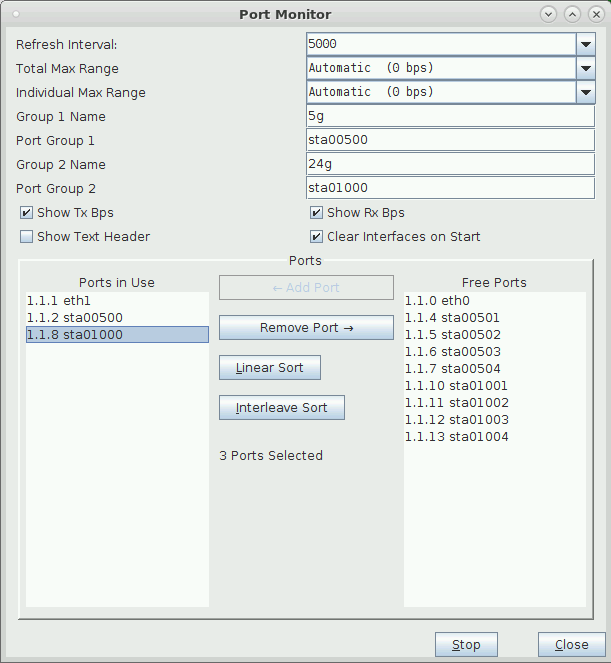
  6. You will see your two ports in the port selector. Click Start to begin the monitor. screenshot
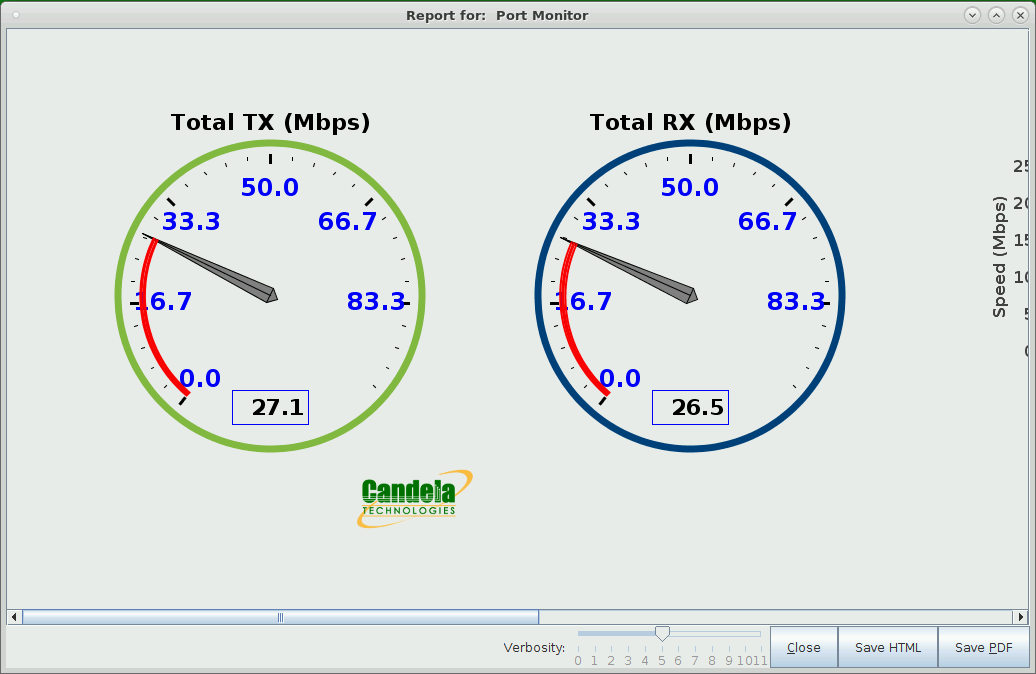
  7. The monitor display was designed to be a full-screen window. You'll see it scroll off to the right. Maximize the window to see more. screenshot
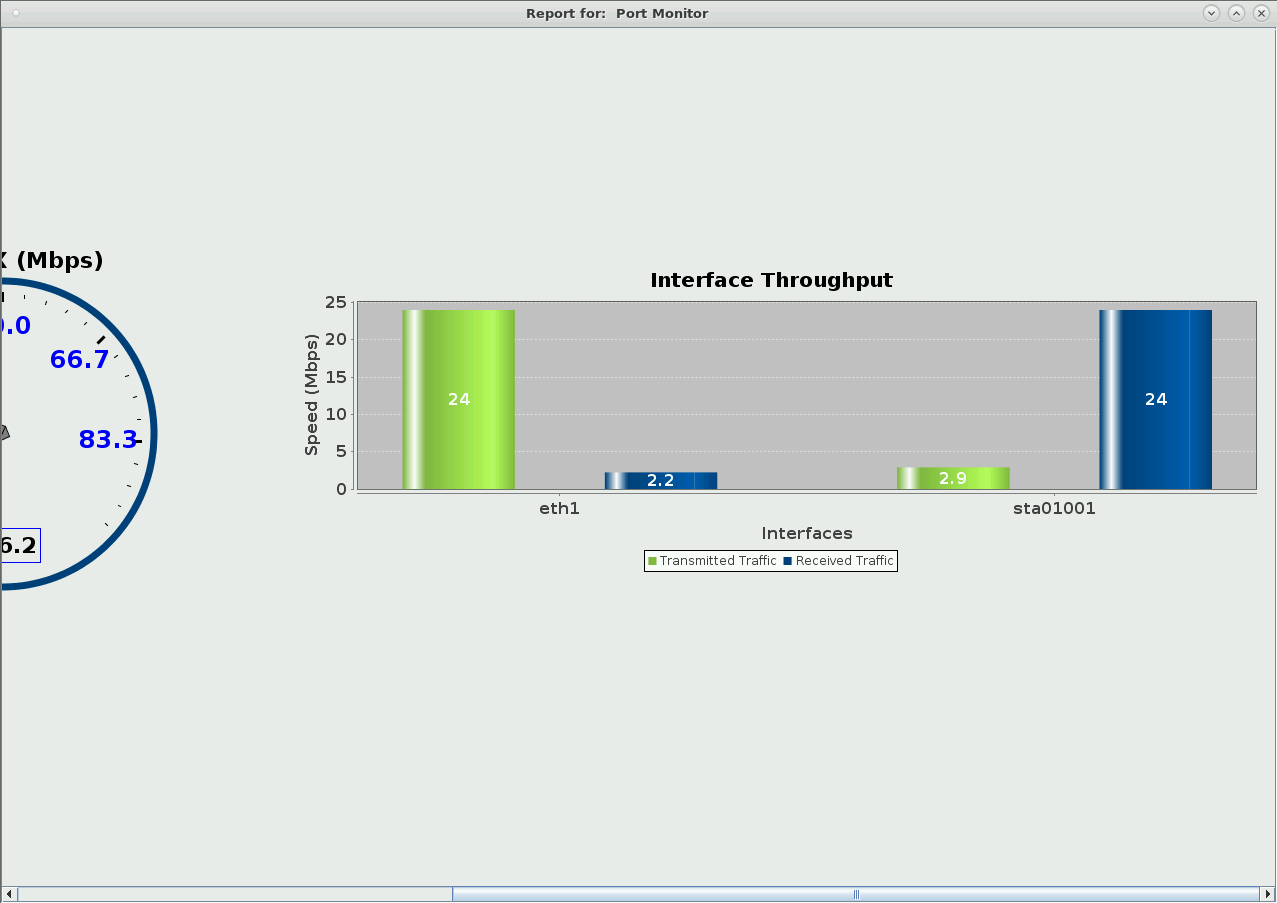
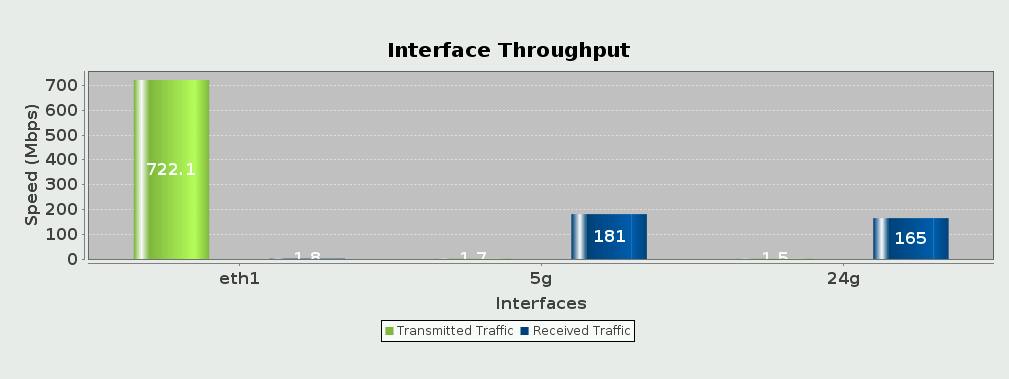
  8. The bar chart on the right side shows port totals. screenshot
  9. Displaying Groups of Ports

  10. You can use the Port Group 1 and Port Group 2 fields in the settings window to display items. The window pictured here shows a station on a 2.4Ghz band and another station on a 5Ghz band. screenshot
  11. The ports for these settings show different channels screenshot
  12. The connections for these ports are both attempting 300Mbps download screenshot
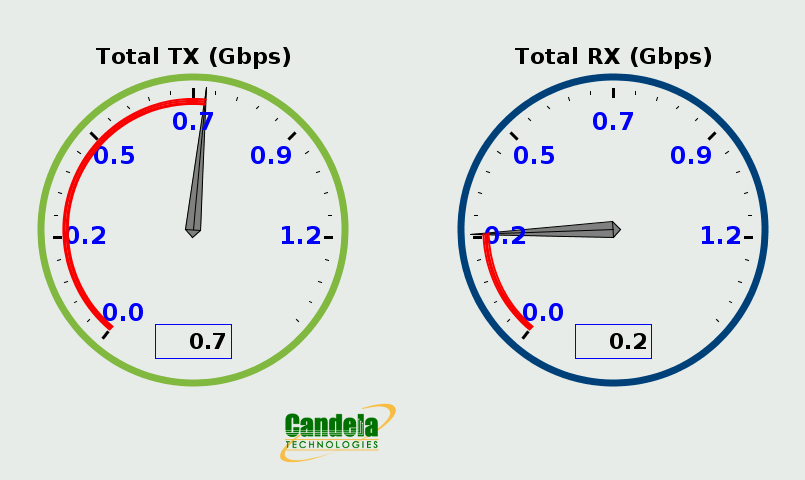
  13. We see a lot of TX from eth1 in the dial, but not much recieved. screenshot
  14. We can compare the 2.4Ghz ports and the 5Ghz ports in the bar charts screenshot

Candela  Technologies, 2417 Main Street, Suite 201, Ferndale, WA 98248, USA
www.candelatech.com | sales@candelatech.com | +1.360.380.1618
Facebook | LinkedIn | Blog